IE Community
Inland Empire Areas
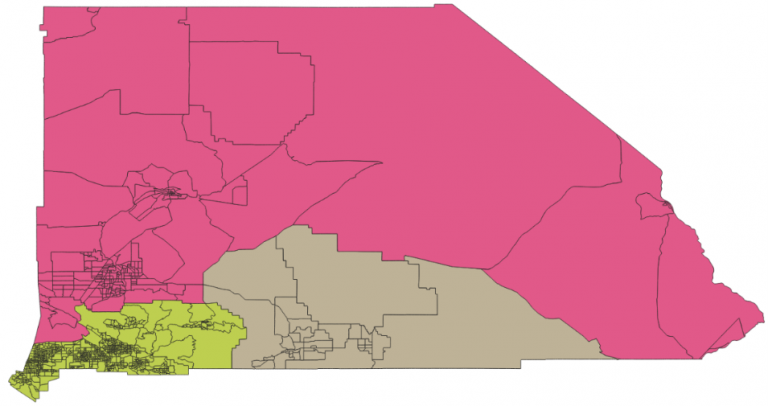

High Desert Area
Regional Coordinator: El Sol Neighborhood Educational Fund
Total Population: 451,483
Population in Hard-to-Count Tracts: 165,222
Percentages in Hard-to-Count Tracts
People Living Below Poverty Line: 33.13%
Unemployment: 5.84%
People without Health Insurance: 13.57%
Foreign-Born Population: 16.33%
People Living with Disabilities: 12.92%
Renter Occupied Units: 58.02%
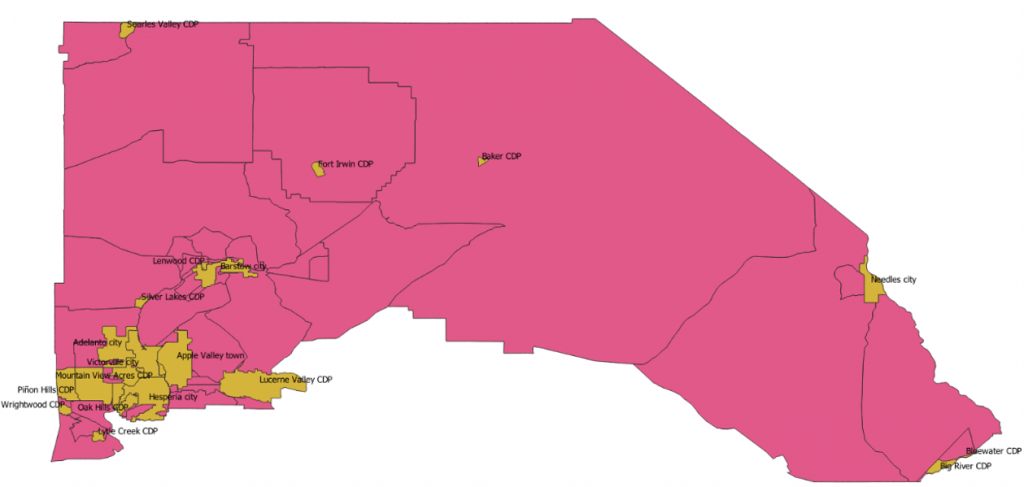
San Bernardino Metropolitan Area
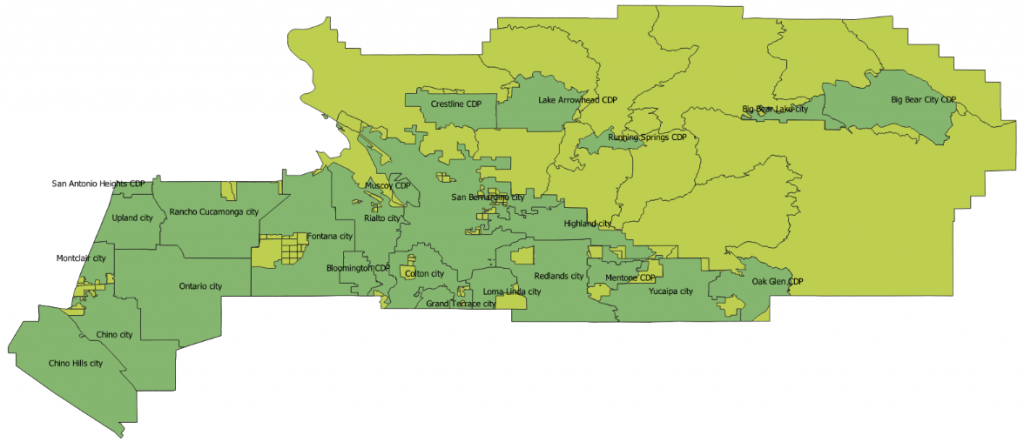
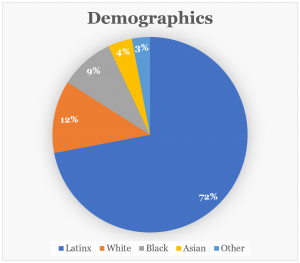
Regional Coordinator: Warehouse Worker Resource Center
Total Population: 1,585,334
Population in Hard-to-Count Tracts: 586,699
Percentages in Hard-to-Count Tracts
People Living Below Poverty Line: 27.51%
Unemployment: 5.66%
People without Health Insurance: 20.12%
Foreign-Born Population: 29.39%
People Living with Disabilities: 10.06%
Renter Occupied Units: 59.76%
Morongo Basin Area
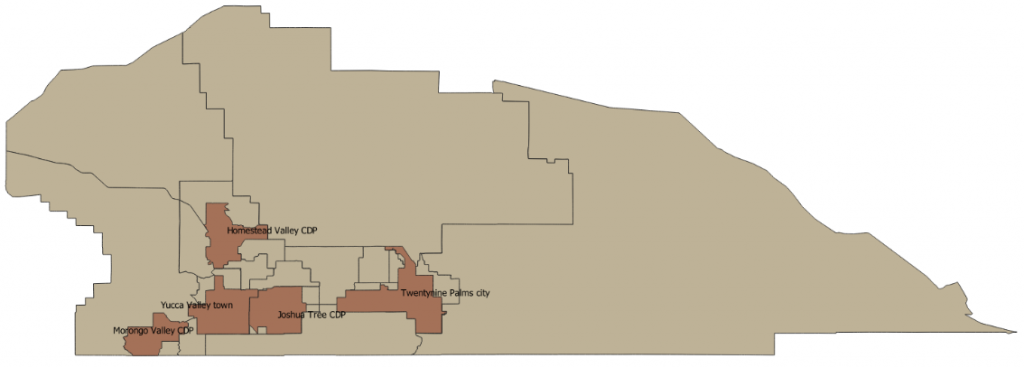
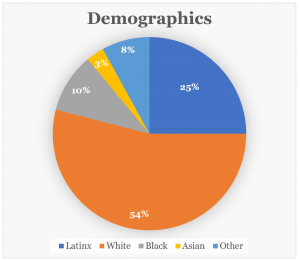
Regional Coordinator: TBD
Total Population: 69,937
Population in Hard-to-Count Tracts: 15,608
Percentages in Hard-to-Count Tracts
People Living Below Poverty Line: 19.11%
Unemployment: 3.72%
People without Health Insurance: 6.25%
Foreign-Born Population: 3.61%
People Living with Disabilities: 5.33%
Renter Occupied Units: 86.71%
Riverside Metropolitan Area
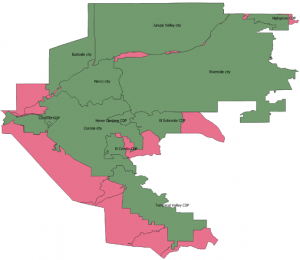
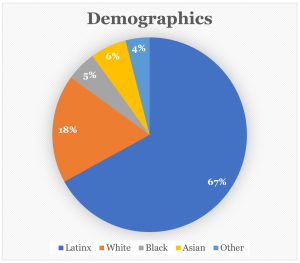
Regional Coordinator: Center for Community Action and Environmental Justice
Total Population: 695,689
Population in Hard-to-Count Tracts: 185,898
Percentages in Hard-to-Count Tracts
People Living Below Poverty Line: 24.85%
Unemployment: 5.83%
People without Health Insurance: 20.25%
Foreign-Born Population: 29.38%
People Living with Disabilities: 9.04%
Renter Occupied Units: 61%
Riverside Central Area
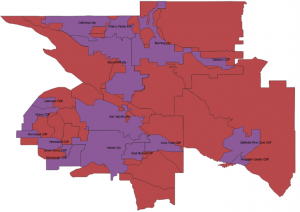
Regional Coordinator: Family Service Association
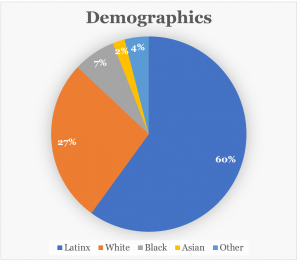
Total Population: 296,506
Population in Hard-to-Count Tracts: 56,534
Percentages in Hard-to-Count Tracts
People Living Below Poverty Line: 31.99%
Unemployment: 8.49%
People without Health Insurance: 20.58%
Foreign-Born Population: 19.85%
People Living with Disabilities: 16.49%
Renter Occupied Units: 59.07%
Riverside Southwest Area
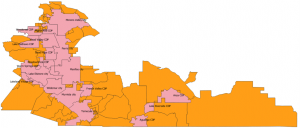
Regional Coordinator: Family Service Association
Total Population: 868,306
Population in Hard-to-Count Tracts: 200,064
Percentages in Hard-to-Count Tracts
People Living Below Poverty Line: 25.28%
Unemployment: 6.61%
People without Health Insurance: 21.59%
Foreign-Born Population: 27.46%
People Living with Disabilities: 10.4%
Renter Occupied Units: 55.63%
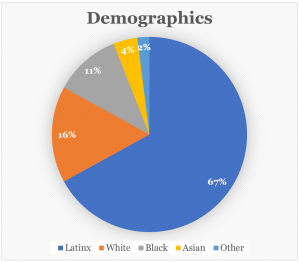
Riverside Eastern Area

Regional Coordinator: Alianza Coachella Valley
Total Population: 463,391
Population in Hard-to-Count Tracts: 155,196
Percentages in Hard-to-Count Tracts
People Living Below Poverty Line: 31.73%
Unemployment: 6.74%
People without Health Insurance: 24.73%
Foreign-Born Population: 32.97%
People Living with Disabilities: 9.96%
Renter Occupied Units: 48.89%
